System Design Every Day
My personal system design learning site — a learning map ordered by prerequisites, where an AI Agent writes three articles a week with interactive simulators, and I steer where the map grows.
- Node.js
- Cursor Cloud Agent
- Cursor Automation
- Claude Code
- Agent Skills
- GitHub Actions
- GitHub Pages
- JavaScript
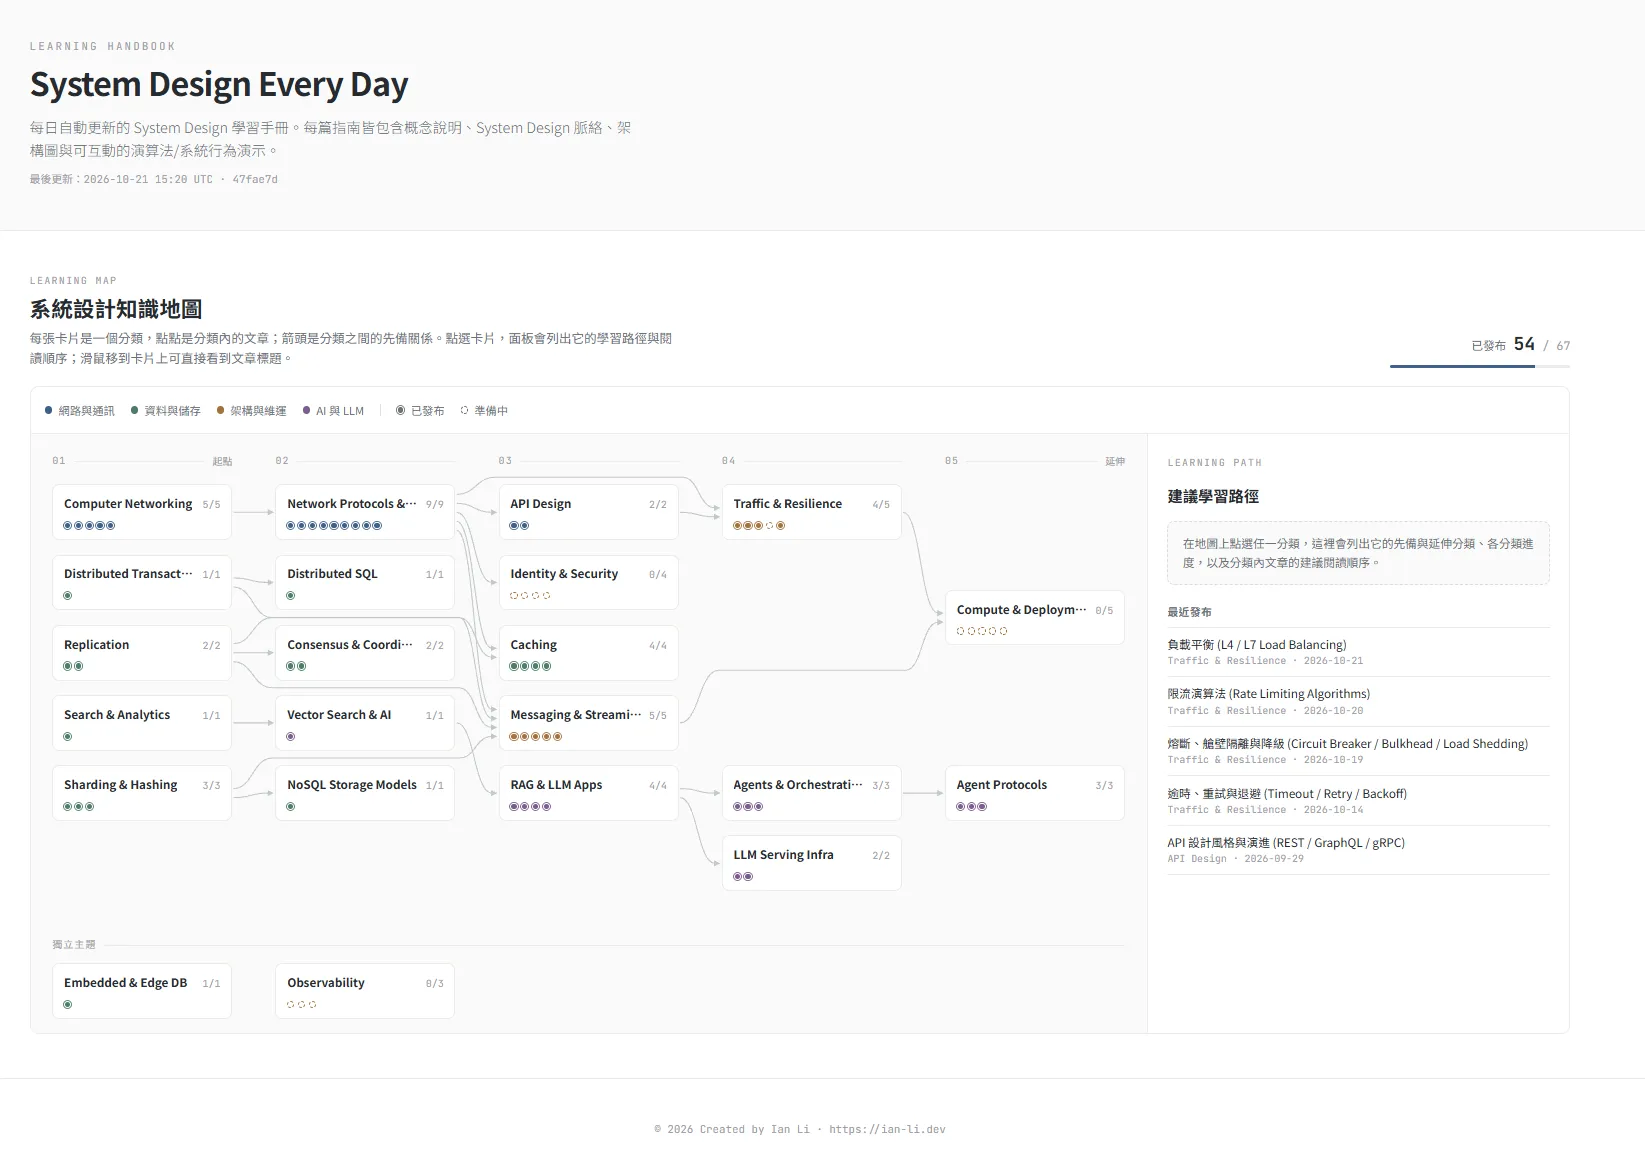
System Design Every Day is a system design learning site I built for myself. It organises what I have read and want to read into a single learning map, grouped by domain and ordered by prerequisites. After I discuss and set the direction for how the map should grow with an Agent, a cloud-sandboxed Agent automatically writes and maintains the articles under a set of gates and rules we designed.
As a backend engineer, I find system design fascinating, ever-changing, and vast — every domain branches into a long list of sub-topics. My introduction to the field was Alex Xu’s System Design Interview — An Insider’s Guide, which I read during my master’s degree; the author used vivid examples to walk through the system design patterns that come up in real-world engineering. Reading Volume 2 after two years on the job, I found much more in the book that resonated with my own experience, along with more places where I agreed — and a few where I had doubts.


What prompted me to build my own entry point for learning system design? There is no shortage of tutorials online — almost any topic you can think of has already been written about, and asking AI is only a few keystrokes away. Yet every time I finished an article, I was left with the distinct feeling that I had only glimpsed the tip of an iceberg in one corner of a vast ocean. Looking up concepts as they come up or diving into a new topic when work demands it is fine in the short run, but over the long term it is far more effective to gather and organise that knowledge in one place: grouping related ideas together helps me connect the dots while learning, and lets me revisit an entire family of concepts at once when I come back to review. That led to the idea of building my own learning map (a knowledge graph) to store and manage all the system design topics I have studied or want to explore.
A Map That Shows Where to Start
The learning map I had in mind is the one on the site’s homepage.
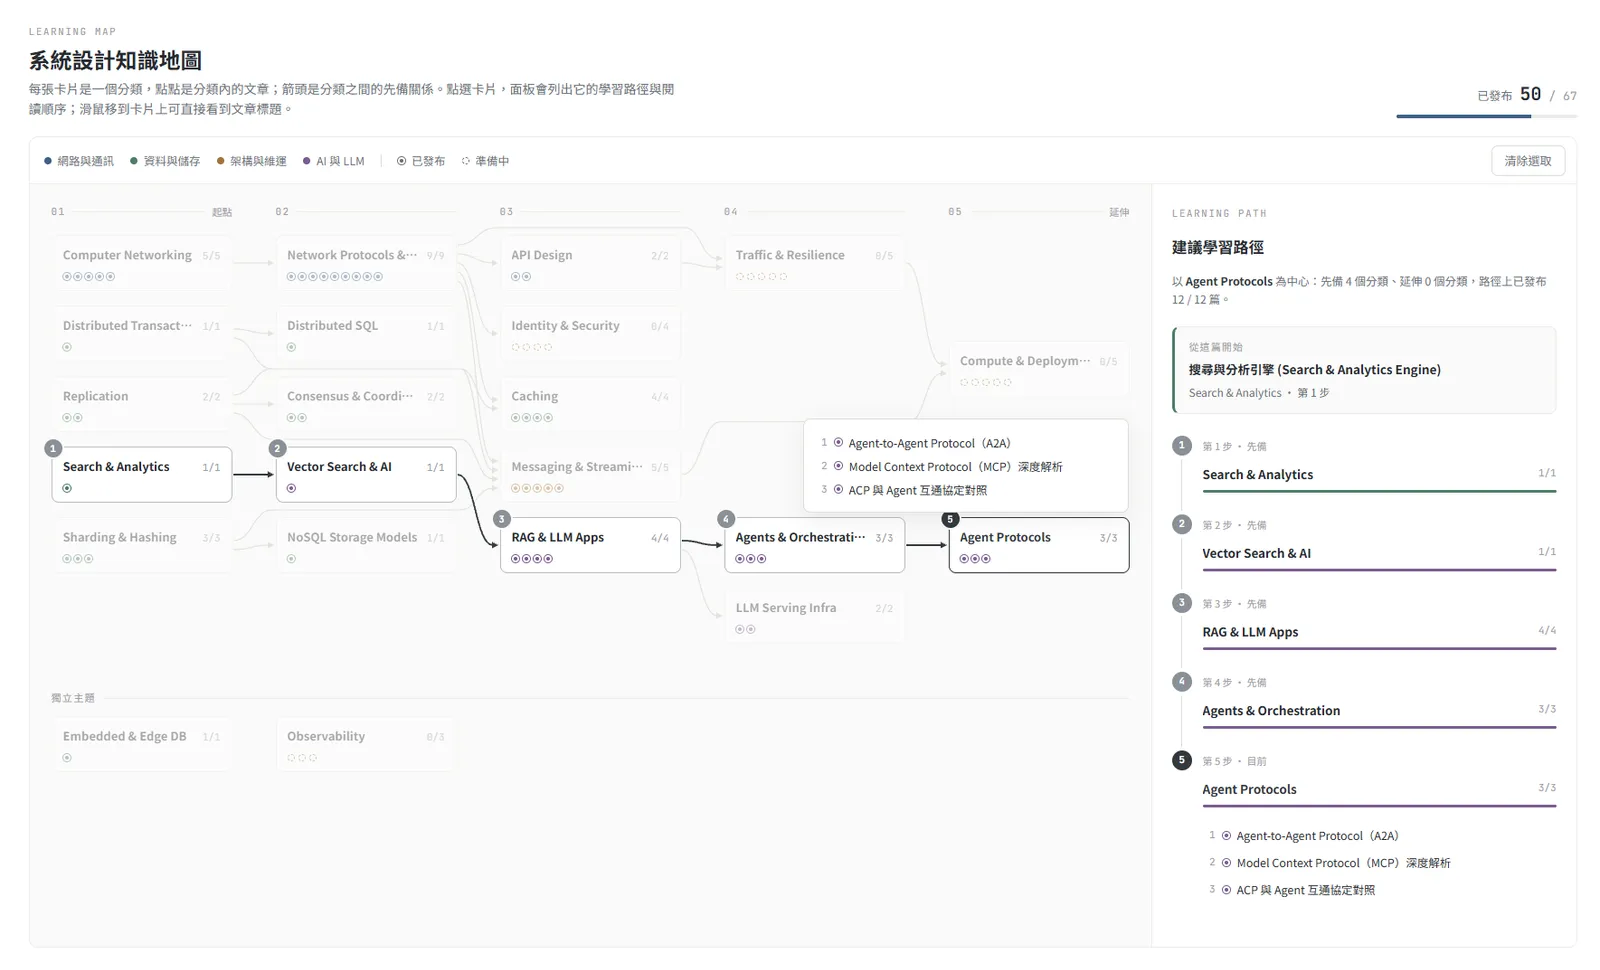
Once topics pile up, the immediate question is “where do I start?”. I ran into this constantly when I used to look things up piecemeal for work, or when I spotted a topic in a book and tried to follow that thread: missing a piece of prerequisite knowledge either limited how much I got out of the reading, or forced me to keep backtracking to more foundational concepts. For instance, it helps to understand data replication before reading about Raft consensus, and vector search before reading about RAG.
My approach in this project is to group related topics into clusters of cards and arrange them by prerequisite order from foundational topics on the left to advanced topics on the right (I tried a radial layout at first, but once the number of topics grew, it became hard to read). Clicking any category on the map highlights its upstream and downstream context and suggests a reading order.
After finishing an article, I can mark it as read on the map to track my progress. The homepage shows how many articles I have read in each category, and the path panel skips articles already marked as read.
Read progress is currently stored in the browser’s Local Storage. Given my own usage habits, that covers what I need on a purely static site without standing up a server.
What Is Inside an Article
Inside an article, the table of contents sits on the left and a fullscreen toggle is in the top-right corner. Each section uses callout boxes to highlight key concepts and trade-offs, or to flag common misconceptions; comparison tables lay out competing approaches side by side; and diagrams match the subject — sequence diagrams for step-by-step order, state diagrams for state transitions. Every section ends with a “one-sentence takeaway” that distils the core point of that section into a single line.
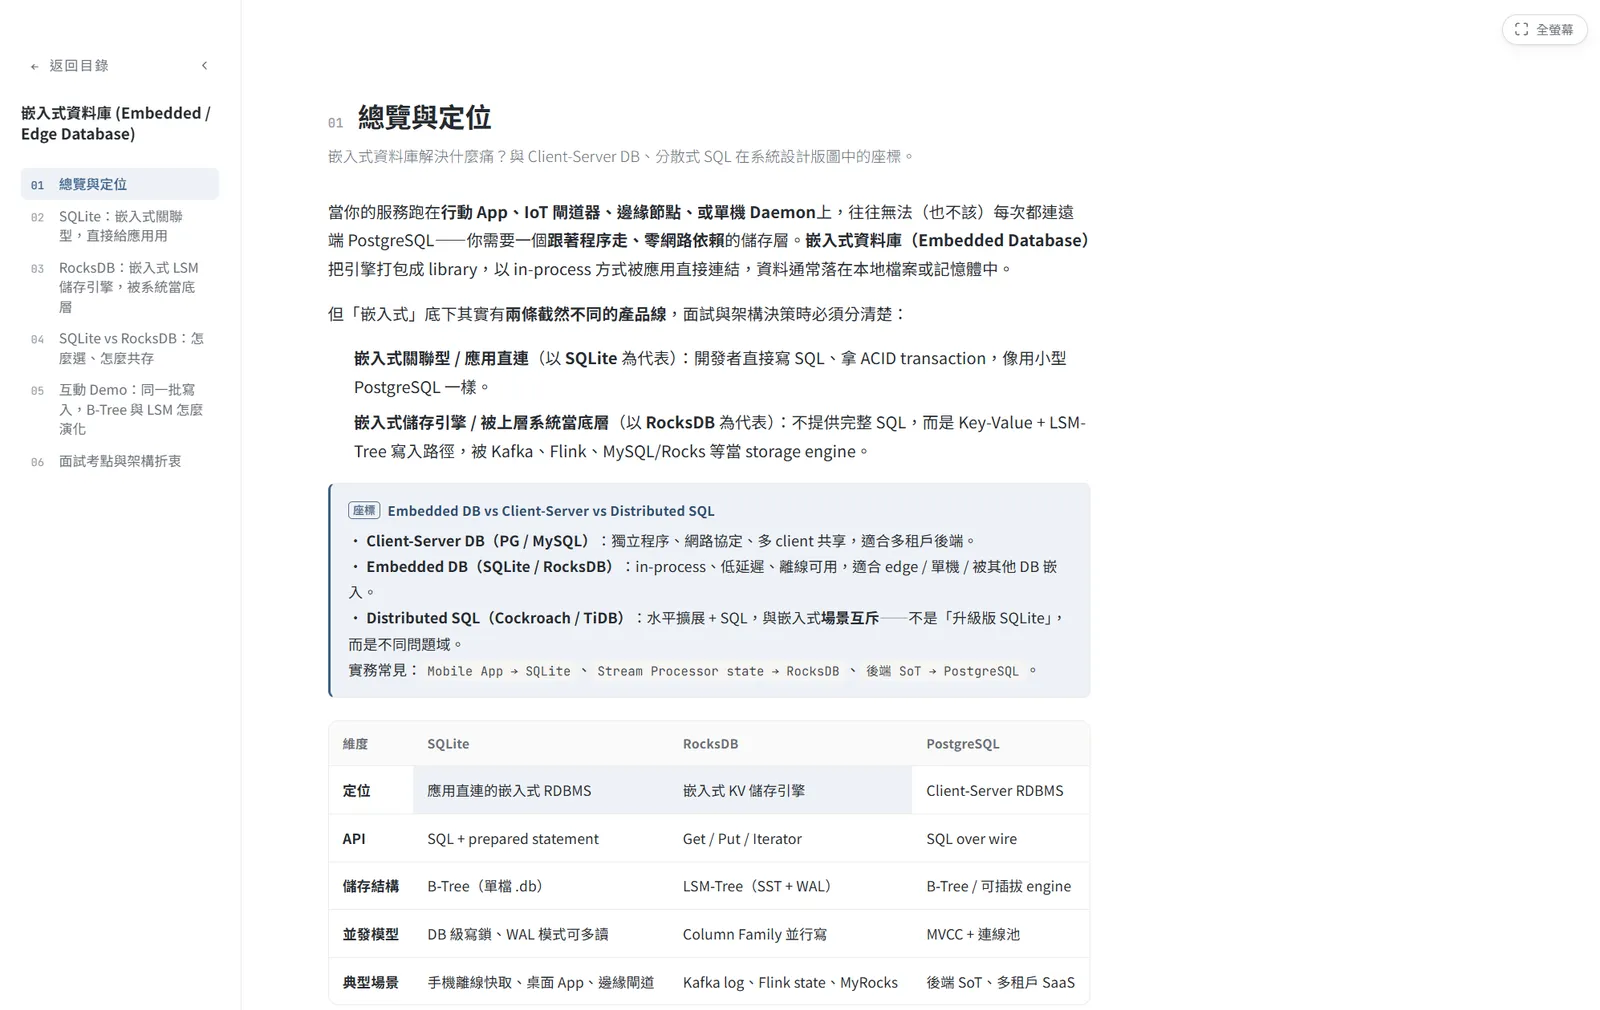
Long before building this site, I had experimented with having an AI Agent generate study documents on specific technical domains. Compared with most articles online, study material written by an Agent has one clear advantage: it can build visual, interactive demos tailored to what you want to understand. On this site, that idea became the interactive simulators I wanted in every article. Readers can drag parameters and switch scenarios to see how the outcome changes in real time, making the core concepts of each section much more tangible. An article can also include several smaller demos, each placed right next to the section it explains.
Different topics call for different styles of interaction, so simulators on the site fall into six forms:
- Step-by-step walkthrough: Click “Next” to step through a fixed sequence — well suited to protocols that naturally proceed in order, such as the TCP three-way handshake.
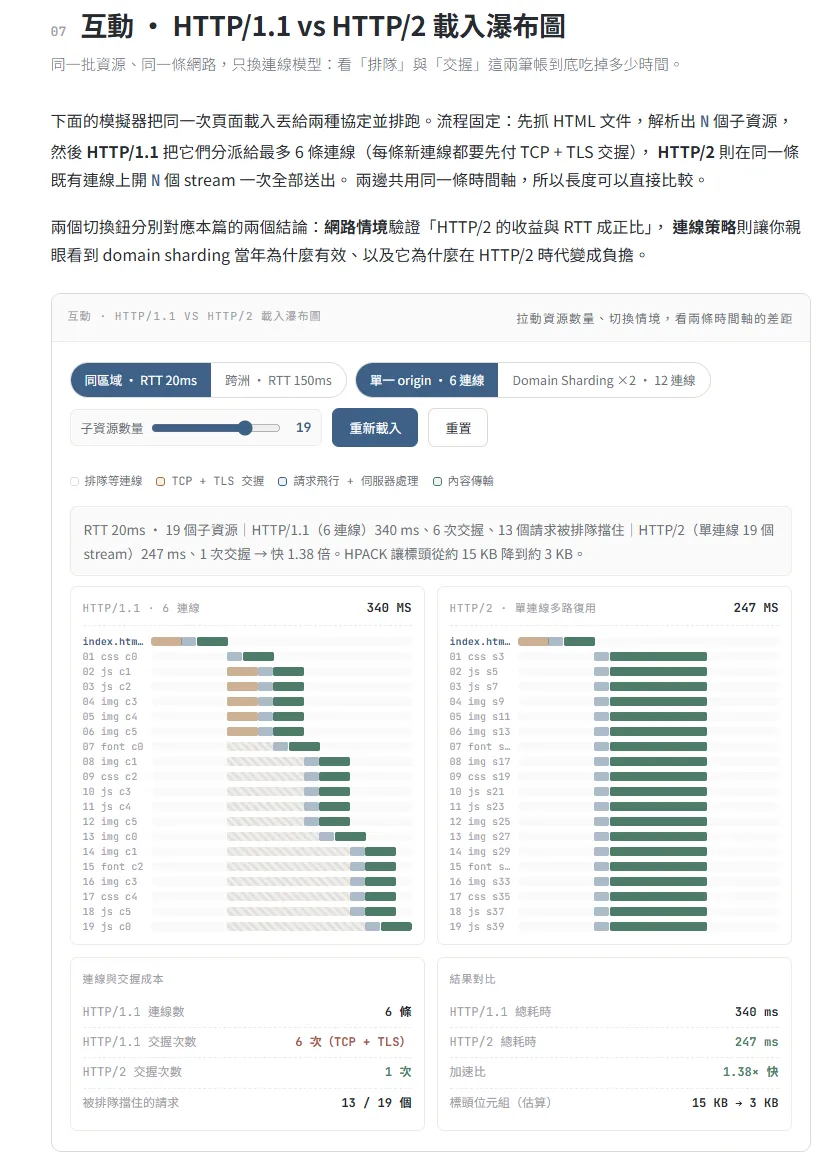
- Parameter sweep: Drag a parameter and watch the result recalculate immediately. In the HTTP/1.1 vs. HTTP/2 article, for example, you can drag the number of page resources and switch network latency and connection strategies while both loading timelines recalculate side by side.
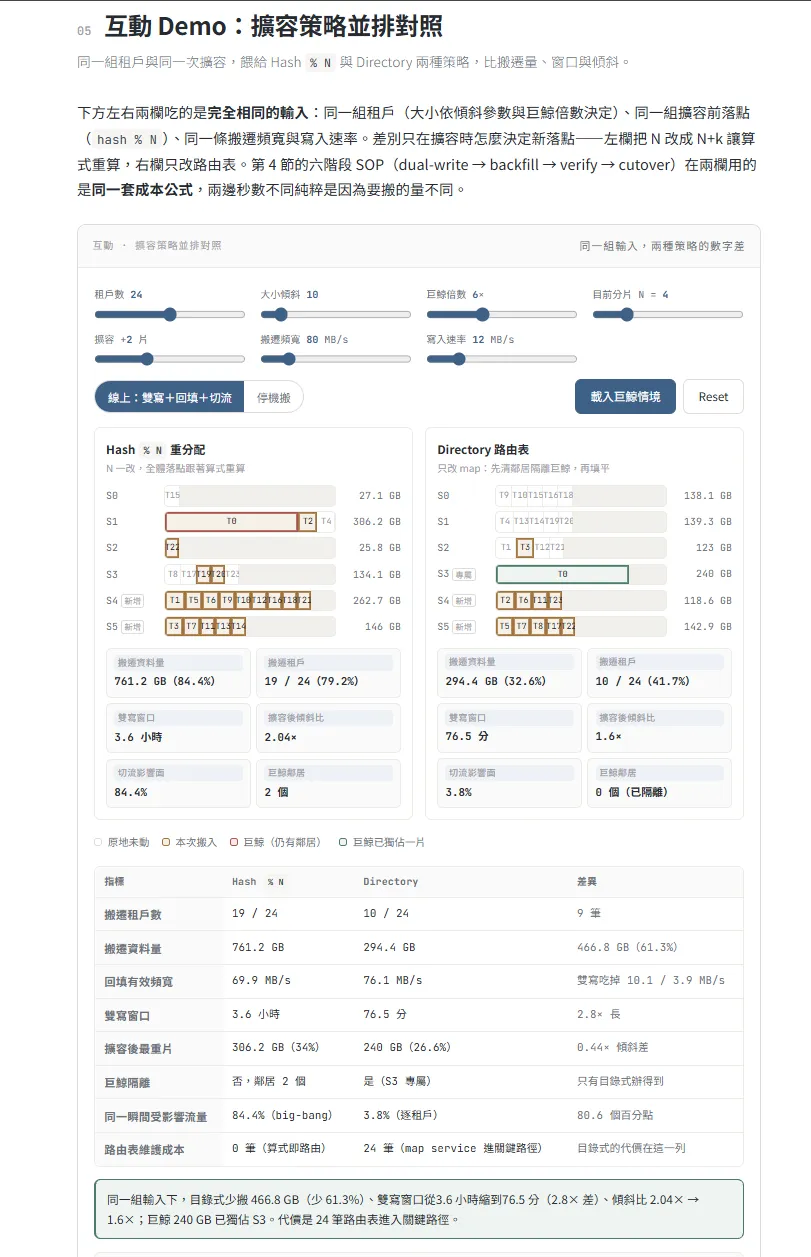
- Side-by-side comparison: Feed the same input into two approaches at once. In the database scaling article, for instance, you can compare how much data two scaling strategies need to migrate, how long dual-writing lasts, and how uneven the data distribution looks afterwards.
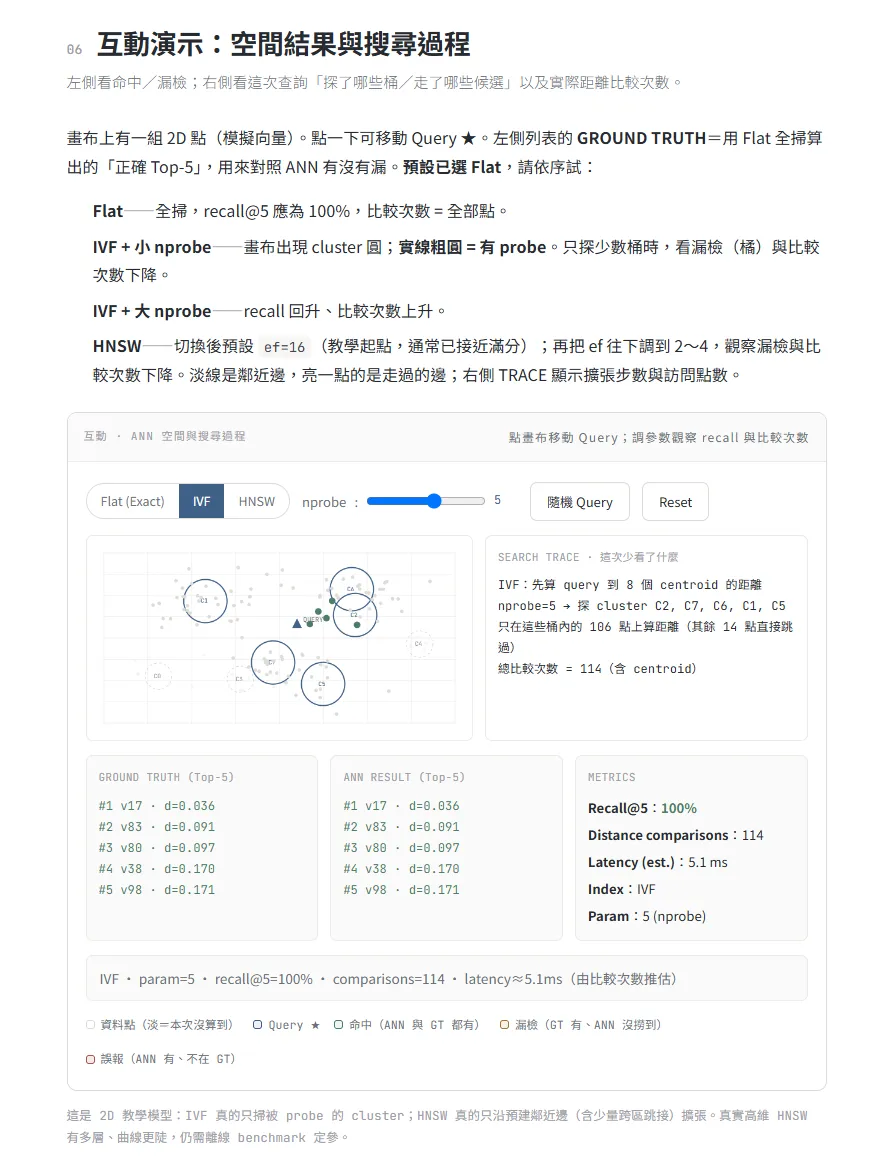
- Spatial visualisation: Drag and click directly on a canvas. In the vector search article, you can move the query point, switch between three index types, and adjust the search scope to compare recall and distance calculations against the exact ground truth.
- Decision helper: Answer a few questions to get a recommendation and the reasoning behind it, suited to “which one should I use when” topics.
- Deconstructor: Enter a piece of real data and break it apart layer by layer with annotations, such as a subnet mask.
The three screenshots below show a parameter sweep, a side-by-side comparison, and a spatial visualisation in order.
That said, having buttons and sliders on screen does not mean a simulator is actually computing anything. In the early days of the site, quite a few demos only looked interactive — how that was discovered and fixed comes up in the validation gates below.
Expanding the Map and the Automated Workflow
Articles on the site are written by an Agent running in a cloud sandbox. The Agent wakes up on a schedule and uses a set of provided CLI tools to understand the repo state and follow the workflow specifications.
I think of this project as a long-term effort — a site I actually come back to read myself. I want the Agent to maintain the project over the long run so the site keeps growing steadily. I chose not to hand a large batch of topics to a swarm of Agents running in parallel, because I had no interest in generating dozens of articles in one go that I would never actually read.
Instead, my role in this project is the helmsman: I decide where the learning map grows, which new domains to add, how those domains connect to existing ones, how each domain is broken down into sub-topics, and how responsibilities are divided among them so that both I and other readers can clearly see the scope and boundaries of each topic within a domain.
Day-to-day maintenance means sitting down with an Agent periodically to discuss those directions and decide the context a given series should focus on — for example, which aspects a particular article should emphasise, how a demo should present a concept, or what kind of real-world scenario a series should revolve around. Expanding the map happens only on my local machine; the cloud Agent is strictly forbidden from adding topics or modifying the map.
The diagram below shows the overall architecture of the workflow: from left to right, learning map maintenance where I step in, the main drafting workflow handled by the cloud Agent, and the pre-release checks run by GitHub Actions before anything goes live.
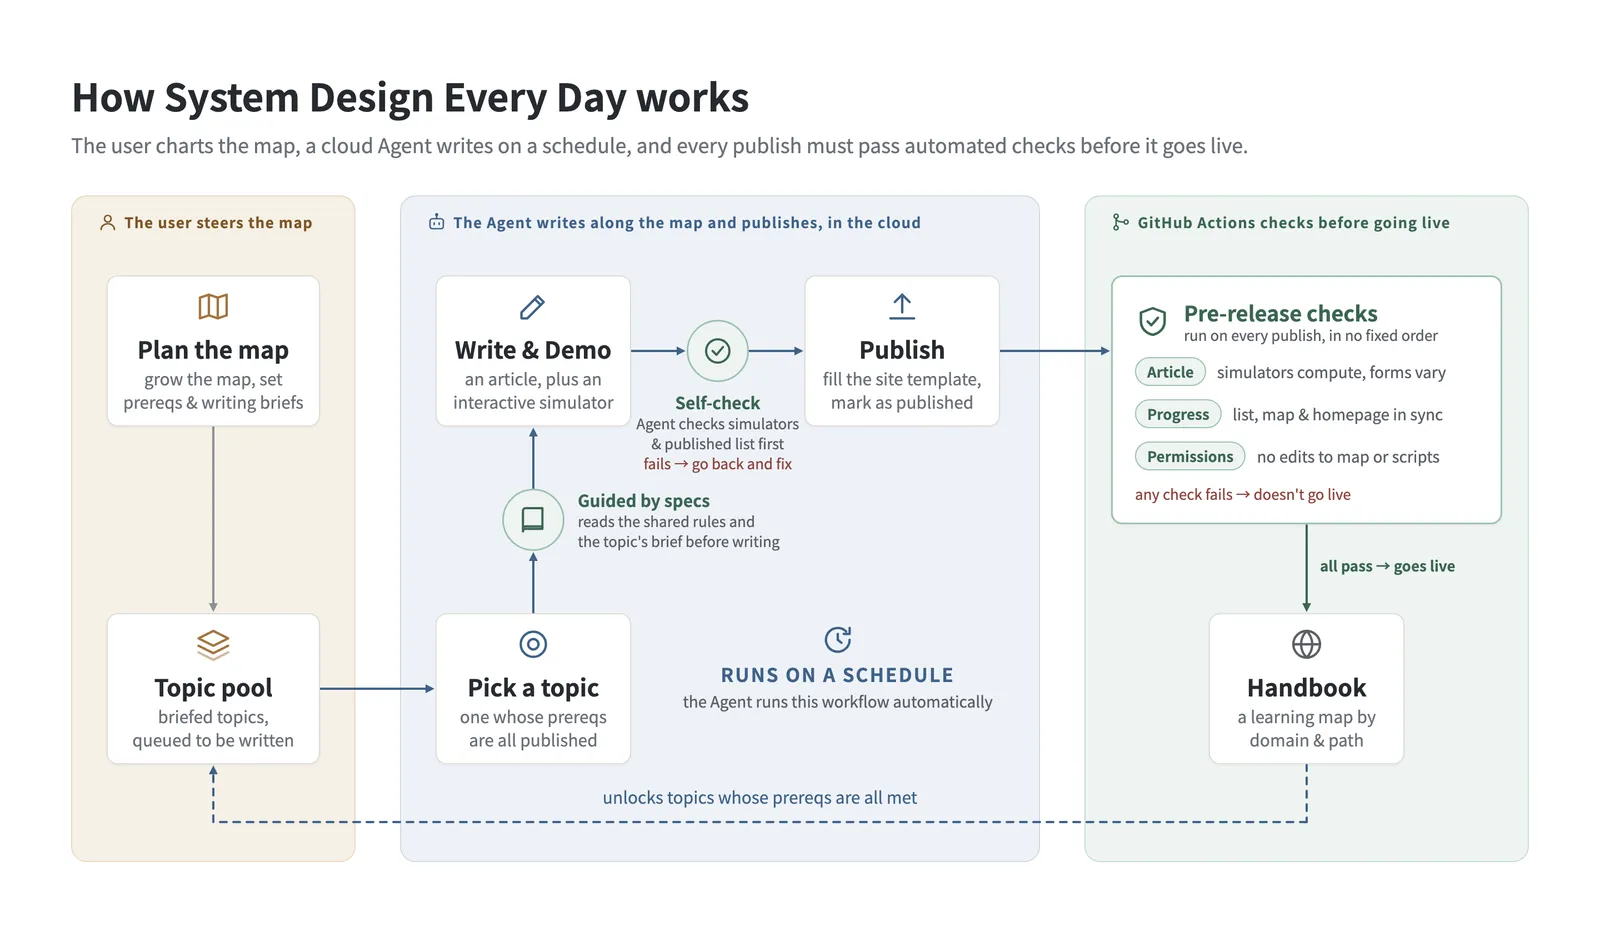
This project has no database — all progress is recorded in persistent state files inside the repo. To keep the Agent from having to read and write the entire state file directly as the number of articles grows, I built a set of CLI tools to restrict its access scope: when the Agent wakes up on schedule, it uses the CLI to query only the next topic to write and the handful of recent publications it actually needs for reference while drafting, and updates the state through the CLI once it finishes. The schedule is set to three articles a week, matched to my own reading pace.
Checking the Agent’s Output by Script Before Anything Goes Live
Because the Agent handles everything from drafting to publishing in the cloud, there has to be a way to verify every piece of output it hands over. The validation pipeline is currently split into three layers. The Agent is required to run the first two layers — article checks and progress updates — at the end of its own workflow; after it pushes to GitHub and before an article goes live, GitHub Actions runs all three layers again, blocking the article from going live if any check fails.
The first layer checks the article itself, which is where the fake demos mentioned earlier get caught. After working in the cloud for a while, the Agent figured out a “player-style” demo on its own: it had buttons and adjustable sliders, but under the hood it was merely stepping through pre-written explanations in sequence, and later articles started copying that corner-cutting pattern. I ended up refactoring all simulators on the site at the time and introduced a rule requiring calculation logic and UI rendering to be written separately. A script can now run the calculation module in isolation, sweep through each parameter one by one, and verify that the output actually changes before a simulator counts as a simulator. Two additional checks inspect the simulator’s component structure and verify that its interaction form does not repeat the most recent articles.
The second layer checks progress. As mentioned earlier, progress is tracked in state files, and if those files ever drift out of sync with the actual articles, the next scheduled run will pick the wrong topic. Before an article goes live, the check verifies that the same topic does not appear in both the to-do and published lists, every article is present on the map, and the homepage is in sync with the state files.
The third layer checks permissions. Expanding the map is done only by me by hand, and GitHub Actions enforces that rule. Every push from the cloud Agent is restricted to specific paths for articles and progress updates. If a push touches the learning map or the scripts, the article is blocked from going live — and subsequent cloud Agent runs remain blocked from continuing to work on top of a broken state until I inspect the situation, fix it, and lift the lock myself.
Looking back, designing this system taught me a great deal in itself. Every time I discuss with an Agent how to expand the learning map, its responses also help me clarify how the topics I am interested in or need for work connect to existing domains, and what other areas of knowledge sit underneath them.
Once the whole workflow was running steadily and I settled into a regular reading routine, I realised the system was helping me much more than I initially expected. Just like building any habit, learning, or keeping up with my running training, the key is steady accumulation — now, with the three layers of checks guarding the cloud pipeline, the site moves forward on its own at three articles a week; and I step back into the role of a reader, opening the site each week to read new articles, play with the simulators, and check topics off the map, then sitting down to plan the next domain to explore once the current topics are nearly finished.